VA API Landscape Analysis and Roadmapping Project Report

This report summarizes Skylight’s evaluation of the VA’s public datasets, which exist within the va.gov web domain, as well as an analysis of what types of data representatives of the Veteran community expressed would be most useful and valuable to Veterans and their supporters if made more digitally accessible and available by the VA. This report also outlines potential resources that can be turned into application programming interfaces (APIs) as part of the VA’s Lighthouse platform initiative, and actions the VA should consider to move forward successfully.
Landscape analysis
The purpose
APIs are the next evolution in the web, and shouldn’t be thought of as the latest tech trend or vendor solution. The first phase of the web was about delivering data and content to humans using a browser. The second phase of the web is about delivering that same data and content to other applications and algorithms using APIs.
With that said, the purpose of this landscape analysis is, in effect, to assist the VA in evaluating the data and content that they’ve made available during the first phase of the web. This, in turn, will help set the stage for the VA to make smart investments in phase two of their web presence.
The VA has already signaled they’re committed to investing in the second phase of their web presence with the announcement of the Lighthouse API platform initiative. Our landscape analysis will help ensure that the Lighthouse program is aware of what types of data and content that the VA has already identified as important to serving the Veteran community. This visibility will allow the Lighthouse program to bring these resources into alignment with the development and operation of their API platform.
The process
To help the VA evaluate the landscape that defines their web presence, we employed a “low-hanging-fruit” process that involved identifying the resources that exist across their web properties. That process relied on a spidering script, which we ran for two weeks (and continue to run). To begin the process, we seeded the script by giving it the root URL for the va.gov domain. The script then proceeded to:
-
Parse every URL on the page and store it in a database;
-
Count every table on the page, and the number of rows that exist in the table;
-
Count every form that exists on the page; and
-
Extract the title from the meta tags for each page.
The script then iterated and repeated this for every URL it found on any web page, working to identify each of the following types of data resources:
-
HTML table with more than 10 rows
-
HTML form
-
CSV file
-
XML file
-
JSON file
-
XLS/XLSX file
The script ignored any URLs external to the seed domain (va.gov) and many common web objects (for example, images, Word docs, and videos).
As each page was processed, the script tried to identify potential data resources to deliver as an API by parsing several elements from them:
-
The title of the page a file was published on,
-
The name of the file itself, and
-
Occasionally a sample of the data.
We took the list of words extracted from this process, and sorted and grouped them by the number of times the word appeared, helping us understand the overall presence of each potential resource. Sometimes this produced a lot of meaningless words, but we worked to filter those out, leaving only the meaningful data resources.
After running the script for a couple of weeks, we spidered nearly 1/3 of the URLs (out a total of 4M+) targeted for processing. That was enough progress to start painting an interesting picture of the VA’s web presence and existing data resources, as described in the sections that follow.
VA’s web presence
The VA has a sprawling web presence, spanning multiple domains and subdomains. We focused our analysis on everything within the va.gov domain. In the future, we can extend the analysis to other domains, but for now we focused on the core VA web presence.
Domain sprawl
The VA’s web presence is spread across a mix of domain levels, including top-level domain and subdomain levels — program, state/region, and city. Domains play a role in providing addresses in the browser so that users can find the resources they need, as well as providing similar addressing for applications to find the resources they need via APIs. The VA domain sprawl reflects the growth of the VA’s web presence, and the lack of overall strategy when it comes to providing web address and routing to all VA resources. The current strategy (or lack thereof) represents the need for location- and program-related resource discovery, whether it’s in the browser, or for other applications via APIs.
We assume there are other domains that haven’t been indexed by our spider, as we were only able to index less than 1/3 of the targeted URLs during our two-week timebox. We can continue indexing and updating numbers beyond this period in order to paint an even more complete picture. Ideally, this would extend beyond the core va.gov domain. Domain and subdomains play an important role in determining how APIs will be accessed, and have a downstream impact on the overall API design, affecting both API path and parameter design. This makes domain and subdomains a top-level consideration early on in the VA’s API journey.
Program domains
After the top-level domains of va.gov and www.va.gov, the most common approach to defining domains is by program, providing the addressing needed for organizing information by relevant programs. We have identified 133 individual program-related domains.
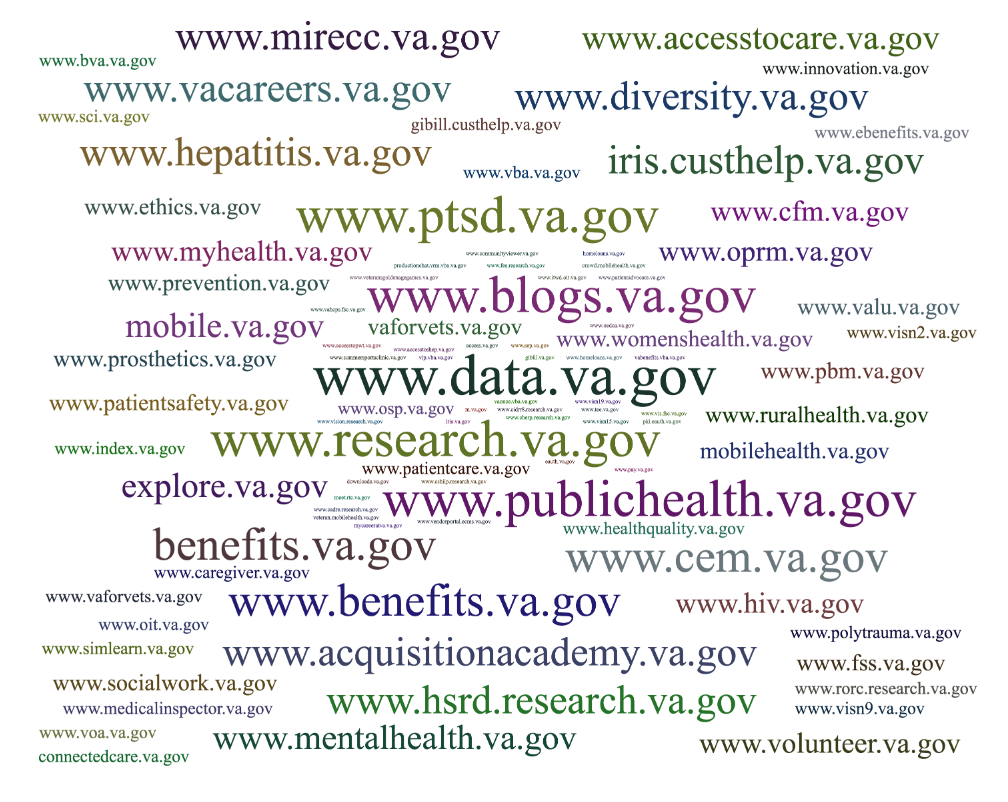
While there aren’t consistent naming conventions used in crafting these subdomains, it does demonstrate the prominence of programs, research, and other related groupings used across the VA web presence for organizing resources.
State domains
Beyond program-related domains, state/region level domains are being used to organize data and content for presentation to consumers. Only 22 subdomains are represented currently, but the practice demonstrates the prominence of these locations when it comes to organizing information.
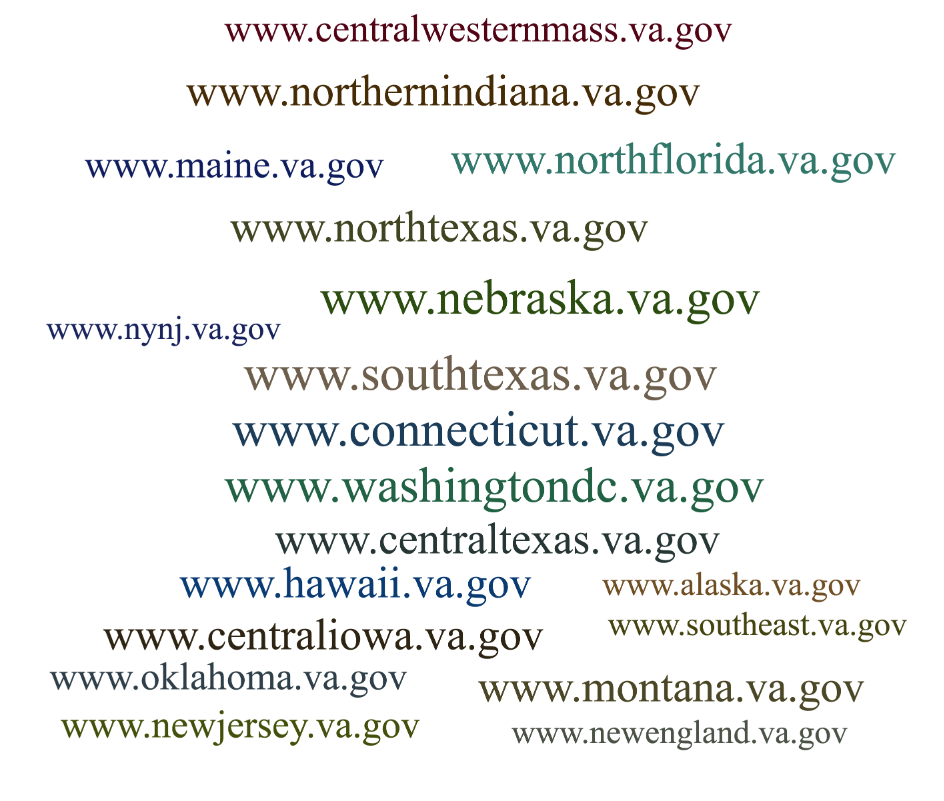
Some states are just paths within the top-level VA domains, while others exist within regional subdomains, with the rest possessing their own subdomain. This demonstrates the importance of states and regions, but also the inconsistency of how domains or paths are used to organize information.
City domains
Lastly, you find many city-related subdomains being used to organize data and content, providing another dimension on how resources are being organized, while demonstrating the dominance of specific cities. We have identified 120 individual city-related domains.
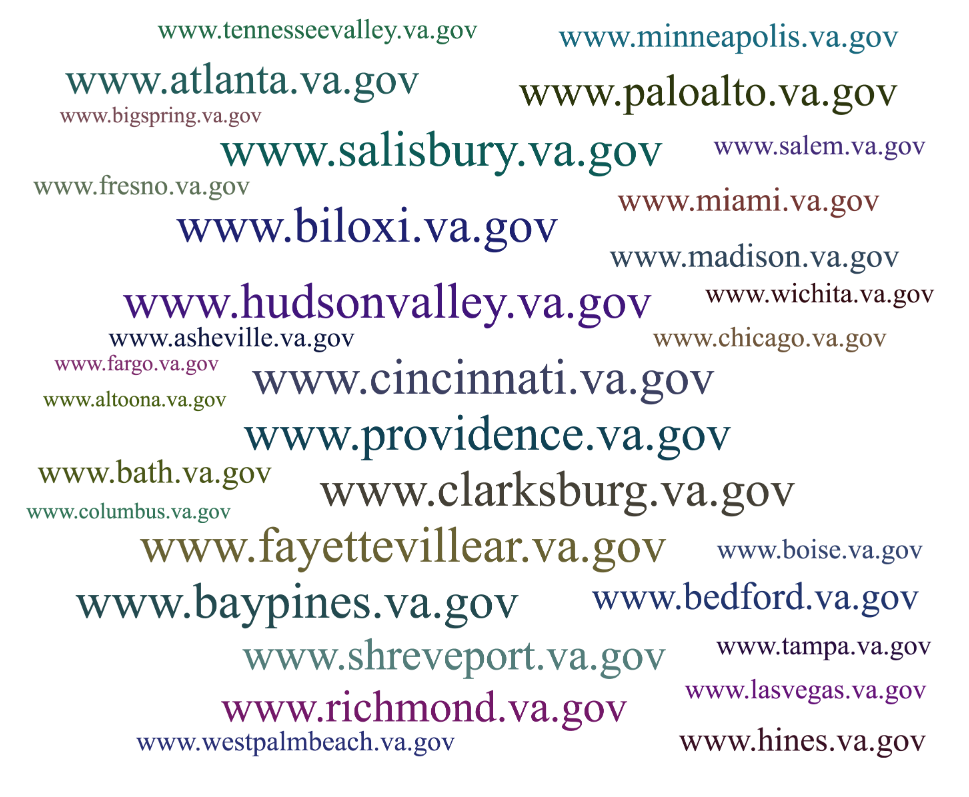
Like states, there isn’t a consistent pattern in which cities have their own subdomain, with others existing as a path within state subdomains or top-level domains. The approach to using cities as part of subdomain DNS addressing further demonstrates the importance of location when it comes to the organization of data and content.
Website outline
As part of the spidering the va.gov domain across the 278 subdomains that exist, over 4M individual URLs were identified, with slightly less than 1/3 of these URLs evaluated for potential data sources to-date. Across these URLs, we took the base path and grouped them by the number of pages and data files that exist.
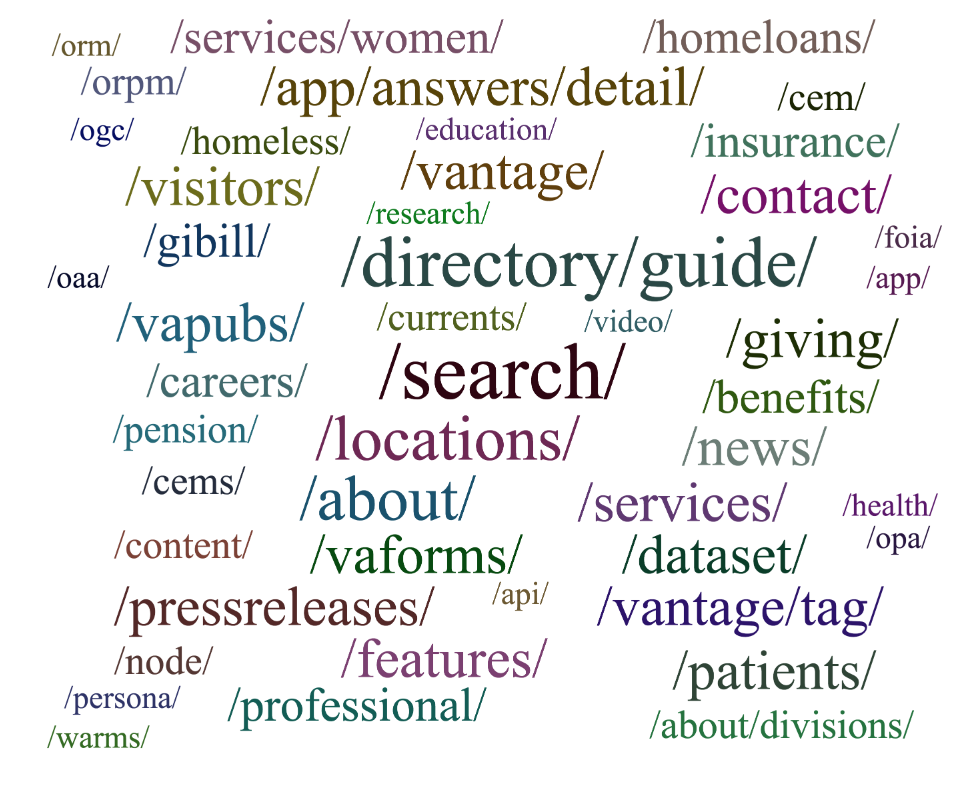
While there are many other paths in use across the VA websites, these paths reflect the top paths in use to deliver data and content. Providing a look at what the most relevant resources are when it comes to providing web access to data and content, which is something that should be considered when delivering the same data and content to other applications.
Data vocabulary
After assessing the titles of HTML pages and the names of files, it’s clear there’s no consistent vocabulary in use across VA resources. This, combined with the use of key phrases, acronyms, and singular and plural variances, make it difficult to cleanly identify resources. We opted to use just keywords over phrases and to not expand acronyms as part of the process due to the difficulty in consistently identifying resources.
Even with the difficulties in identifying some resources, we were still able to paint a fairly compelling picture of the resources being exposed as common data formats across VA web properties. That’s because we were able to isolate, group, and identify words that are most commonly associated with resources. From there, we were able to establish some resource lists, which we have organized visually as tag clouds and tag lists.
Data resources
Data is available across VA websites in a variety of formats. We focused on a handful of easy to identify formats, reflecting the low-hanging-fruit aspect of this landscape analysis. While there’s data locked up in simple text files and zipped packages, we chose to look for the easiest to identify and the easiest to publish data sources. Data that’s published by humans usually take the form of CSV files, spreadsheets, and HTML tables. Data that’s published by systems usually take the form of JSON and XML.
Data formats
Each of type of format that we targeted provides a different story as to the type of resources being published. Publication implies that those resources carry some level of value and importance to VA stakeholders, and, potentially, to Veterans, their supporters, and other consumers of this information. We worked to harvest all the data available from several formats, but also worked to identify the top resources available from each type.
CSV files
We discovered 534 CSV files containing a variety of data. By parsing the titles of the web pages these CSV files were linked from, and the names of some of the files, we identified handful of top resource types present across these files.

CSV files tell a particular story because they were most likely published by people working at the VA, who exported the files from spreadsheets and made them available on the website for a reason. This makes them relevant to the VA’s API conversation. You can view a list of CSV resources, as well as a complete list of CSV files on the GitHub repository.
XLS/XLSX files
We identified 6,077 spreadsheets containing a variety of data. After parsing these files for semantic meaning, we identified handful of top resource types present across these files.
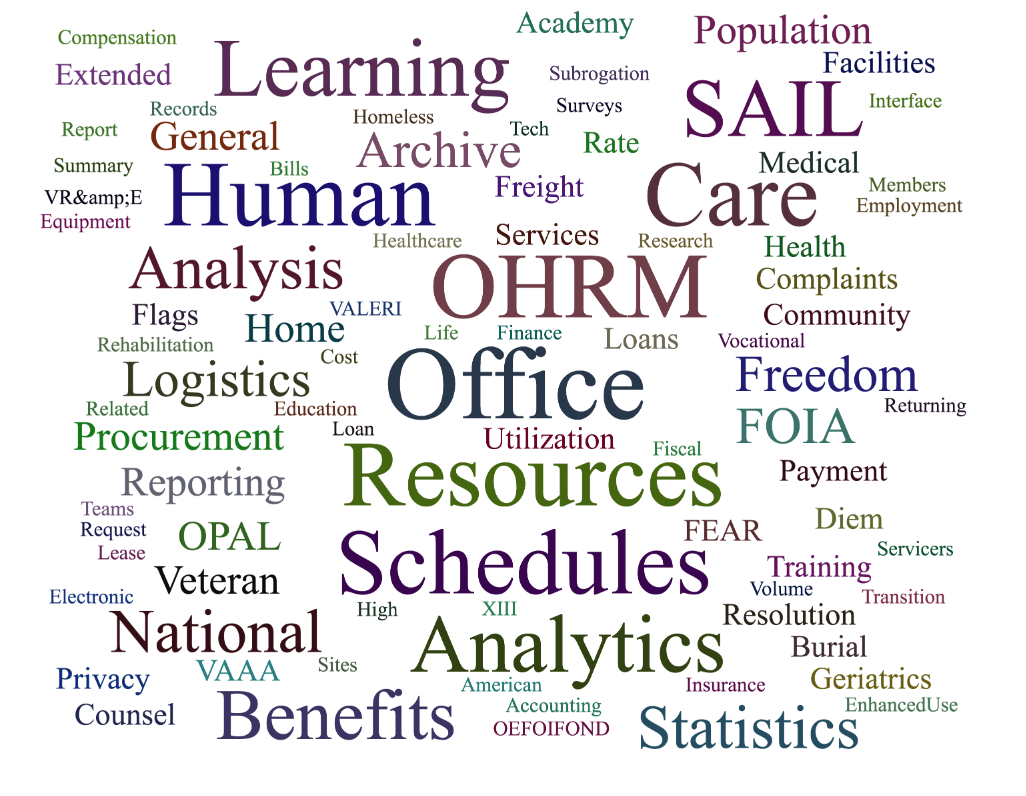
Similar to CSV files, the presence of spreadsheets tell a very human story. Spreadsheets are the #1 source of data on the web, and reflects the data management and publishing practices across the VA. After evaluating what types of resources are available across these spreadsheets, we have been considering the use of spreadsheets as a data source, as well as a data publishing tool. You can view a list of XLS/XLSX resources, as well as a complete list of XLS/XLSX files on the GitHub repository.
JSON files
We identified 467 JSON files containing a variety of data. Unlike the CSV and spreadsheet data sources, JSON files likely represent a more modern systems approach to publishing data and a whole another set of data sources, which should be considered when deploying APIs.
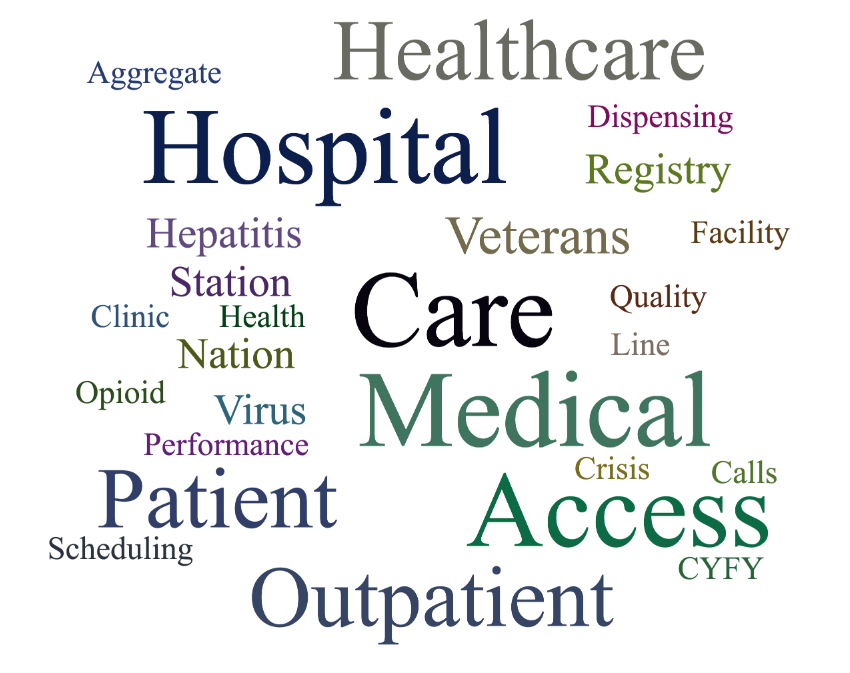
JSON reflects the latest evolution of data publishing at the VA. But they are only a small subset of the data being made available across VA web properties. This implies they have only become a recent priority when it comes to publishing data in a format that is consumable by developers and computers. You can view a list of JSON resources, as well as a complete list of JSON files on the GitHub repository.
XML files
We found 3,099 XML files containing a variety of data. Like JSON files, XML files represent system-generated publication of data. Unlike JSON, however, XML reflects an older systems approach to data publication. And are likely being generated by legacy systems that’ll be important to interface with over the course of the VA’s API journey.
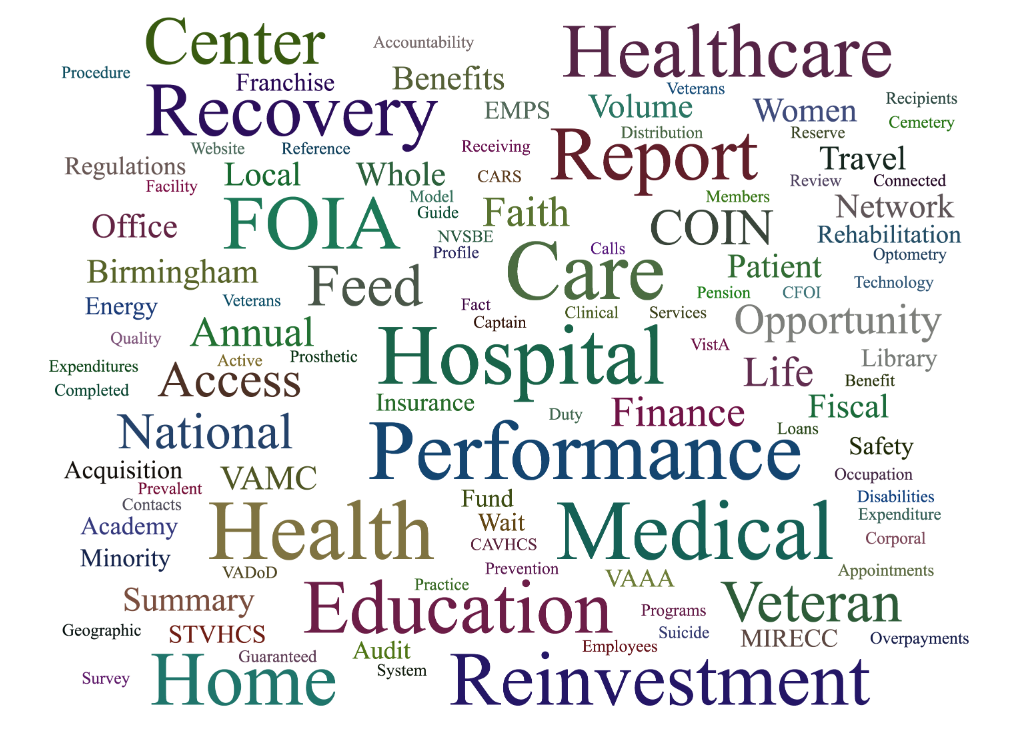
XML represents a large portion of the data being published across VA web properties. This list of priority resources represents a significant part of the system-based publishing of data occurring at the VA. And provides a large snapshot of the systems that should be evolved as part of the deployment of APIs. You can view a list of XML resources, as well as a complete list of XML files on the GitHub repository.
HTML tables
We identified 8,393 pages that had tables on them with over 10 rows. These tables represent potentially valuable data and should be considered as part of the VA’s API deployment conversations.

While HTML tables tell a story about top resources that VA stakeholders thought website users needed access to, these tables also represent data that was published with potential search engine optimization (SEO) in mind. In other words, someone wanted the data to be indexed by search engines in order to make it more readily accessible. You can view a list of table resources, as well as a complete list of pages containing tables on the GitHub repository.
HTML forms
We identified 9,439 pages with more than one form present, which is usually just a basic search. Similar to HTML tables, these forms provide a window into how the VA is making data available for users to search, explore, and consume in the browser. This, in turn, tells another story of what types of resources are published to VA websites.

HTML forms often times provide a search mechanism for other table, CSV, JSON, XML, and spreadsheet resources, many of which are listed in the sections above. HTML forms tell their own story as to how and why data are being published across VA websites. And offer another source of resources that are being made available and should be considered as part of the VA’s API deployment efforts.
Data.gov
The only external source of data that we analyzed was data.gov, which hosts a number of VA data resources. While somewhat out-of-date, the VA datasets on data.gov tell an important part of the story that should be considered as part of the Lighthouse efforts. There are a lot of lessons to be learned from how data.gov has been used, beyond just understanding what resources have been published there.
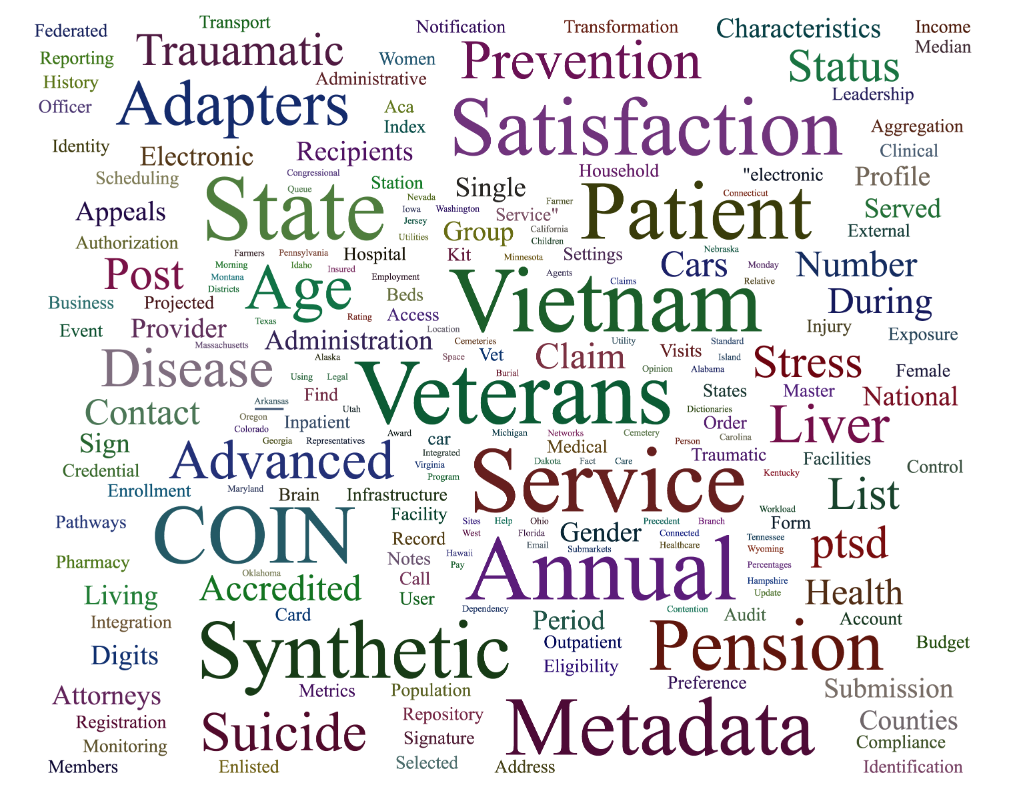
The resources published to data.gov reflect the VA’s recent past when it comes to making data resources available and accessible via manual downloads and APIs. We think that the most important lesson that the VA should take away from its experience with data.gov is that the VA should own all the data and API resources and syndicate them as part of other external efforts. That way the VA owns the full scope of the effort, which will ultimately result in the VA being more invested in API operations. You can view a list of data.gov resources, as well as a complete list of data files on the GitHub.
Humanizing the data
To give us a more human perspective on what types of data resources are most valuable to Veterans and their supporters, we facilitated a series of online workshops using Mural. About 50 people total participated across all three workshops, with about 40% reporting as Veterans and 60% non-Veterans. During these workshops, we employed the KJ technique for establishing group priorities. The KJ technique relies on a focus question to drive the results of the workshop. We used the following focus question:
“What types of data, content, and other resources would be most useful to Veterans and their supporters if the VA could make them more available and accessible on the web, mobile devices, and other platforms?”
The following images capture the results of each workshop:
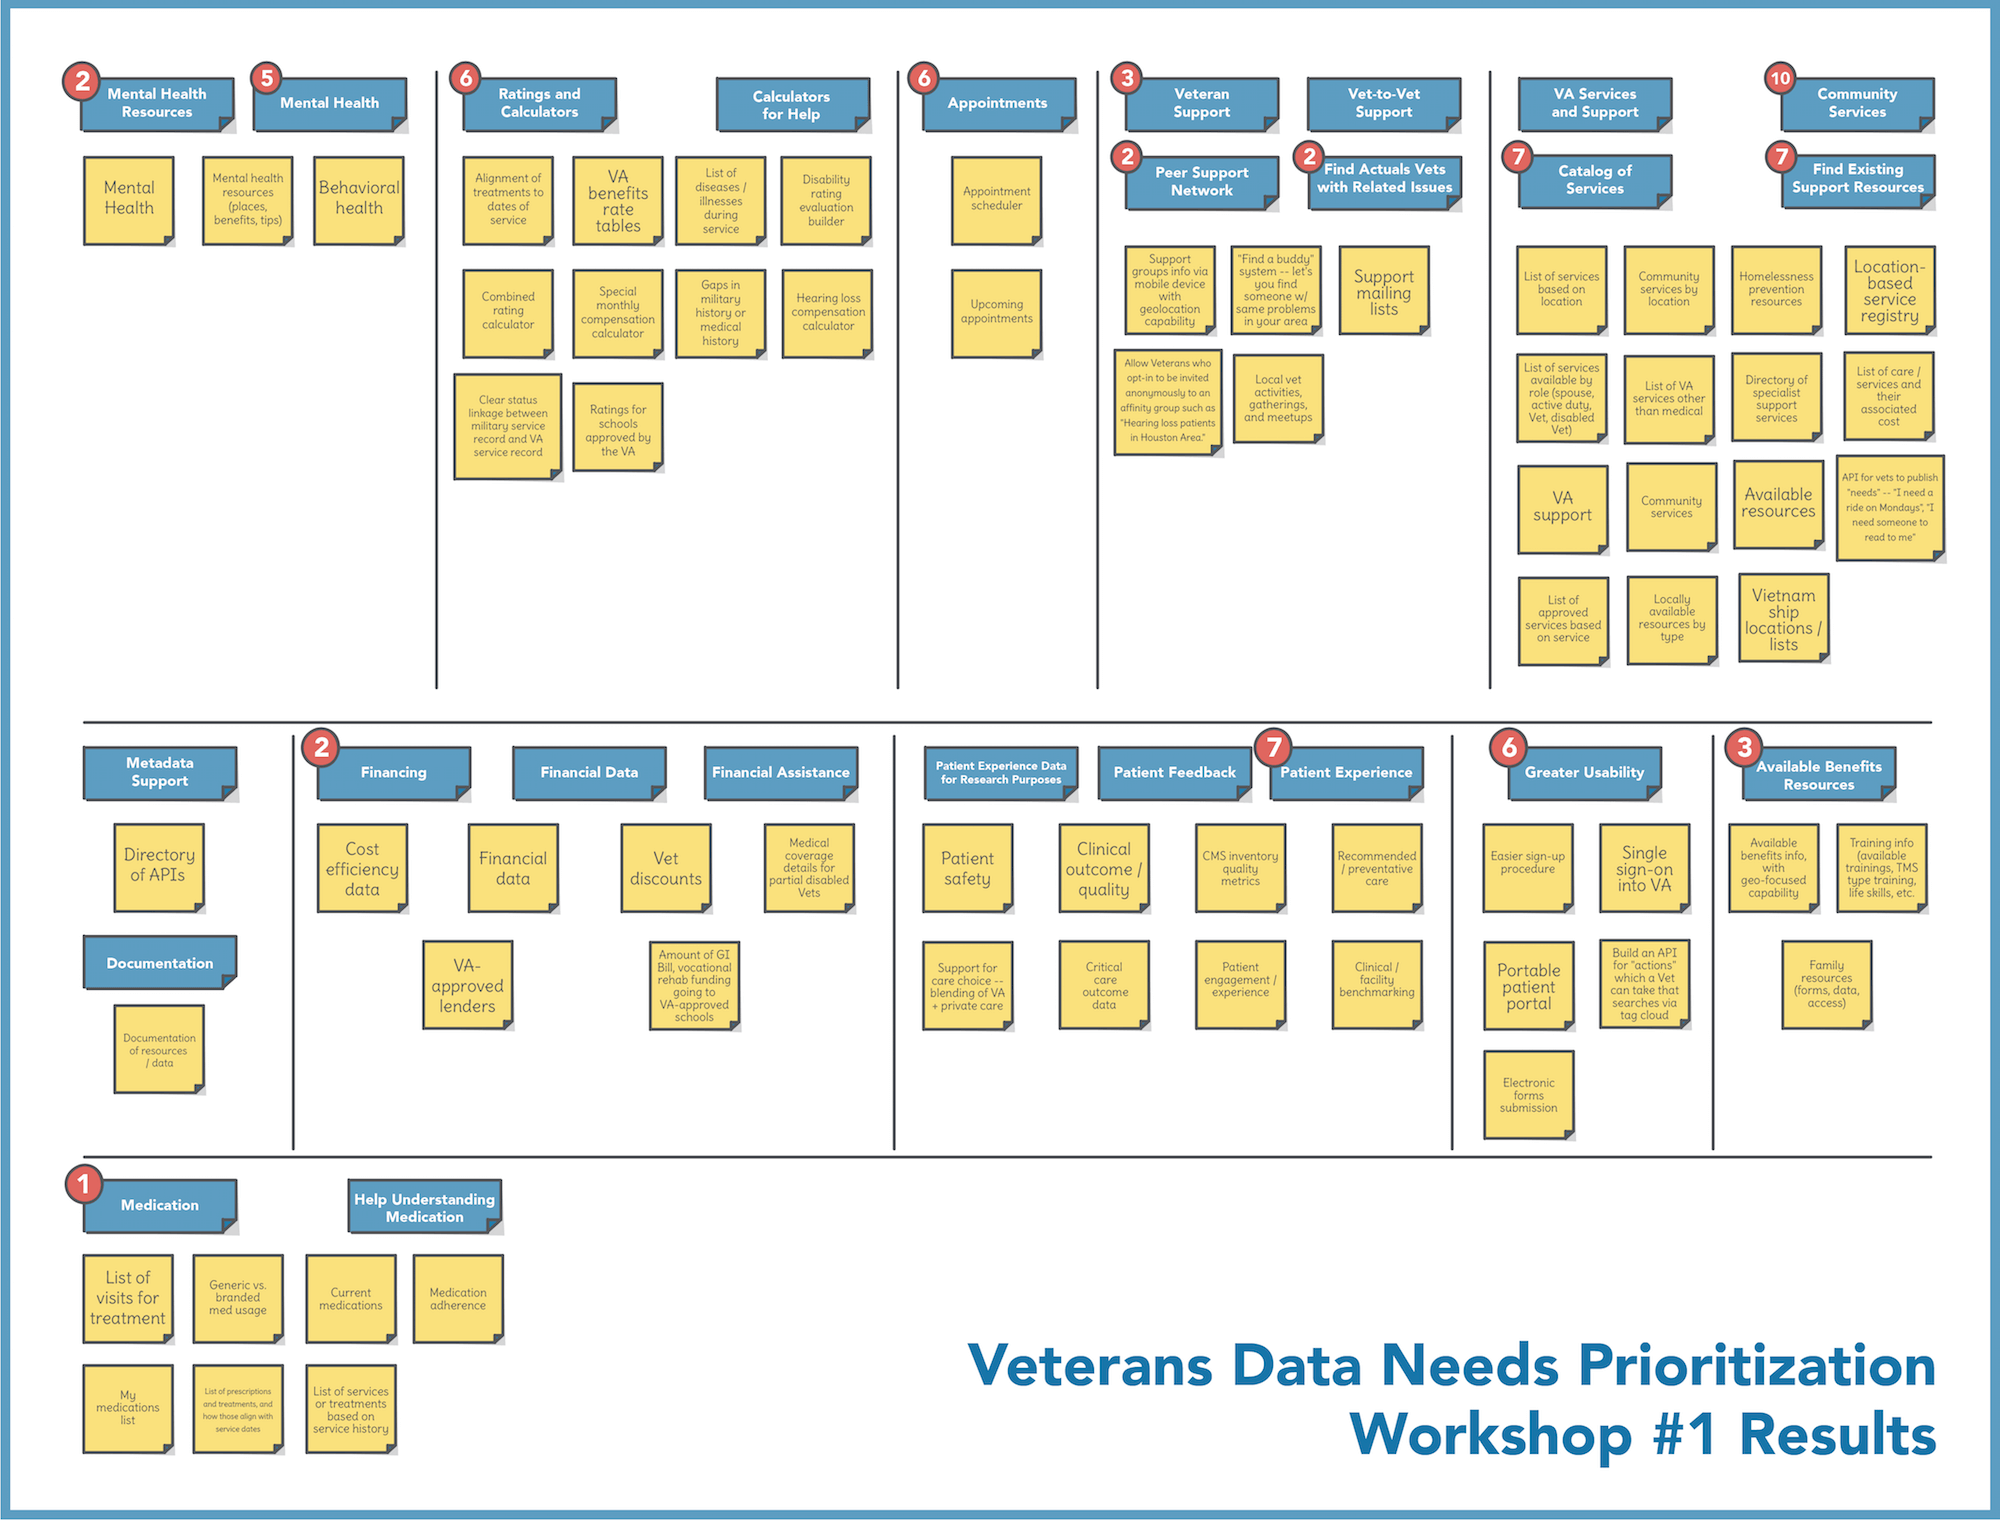
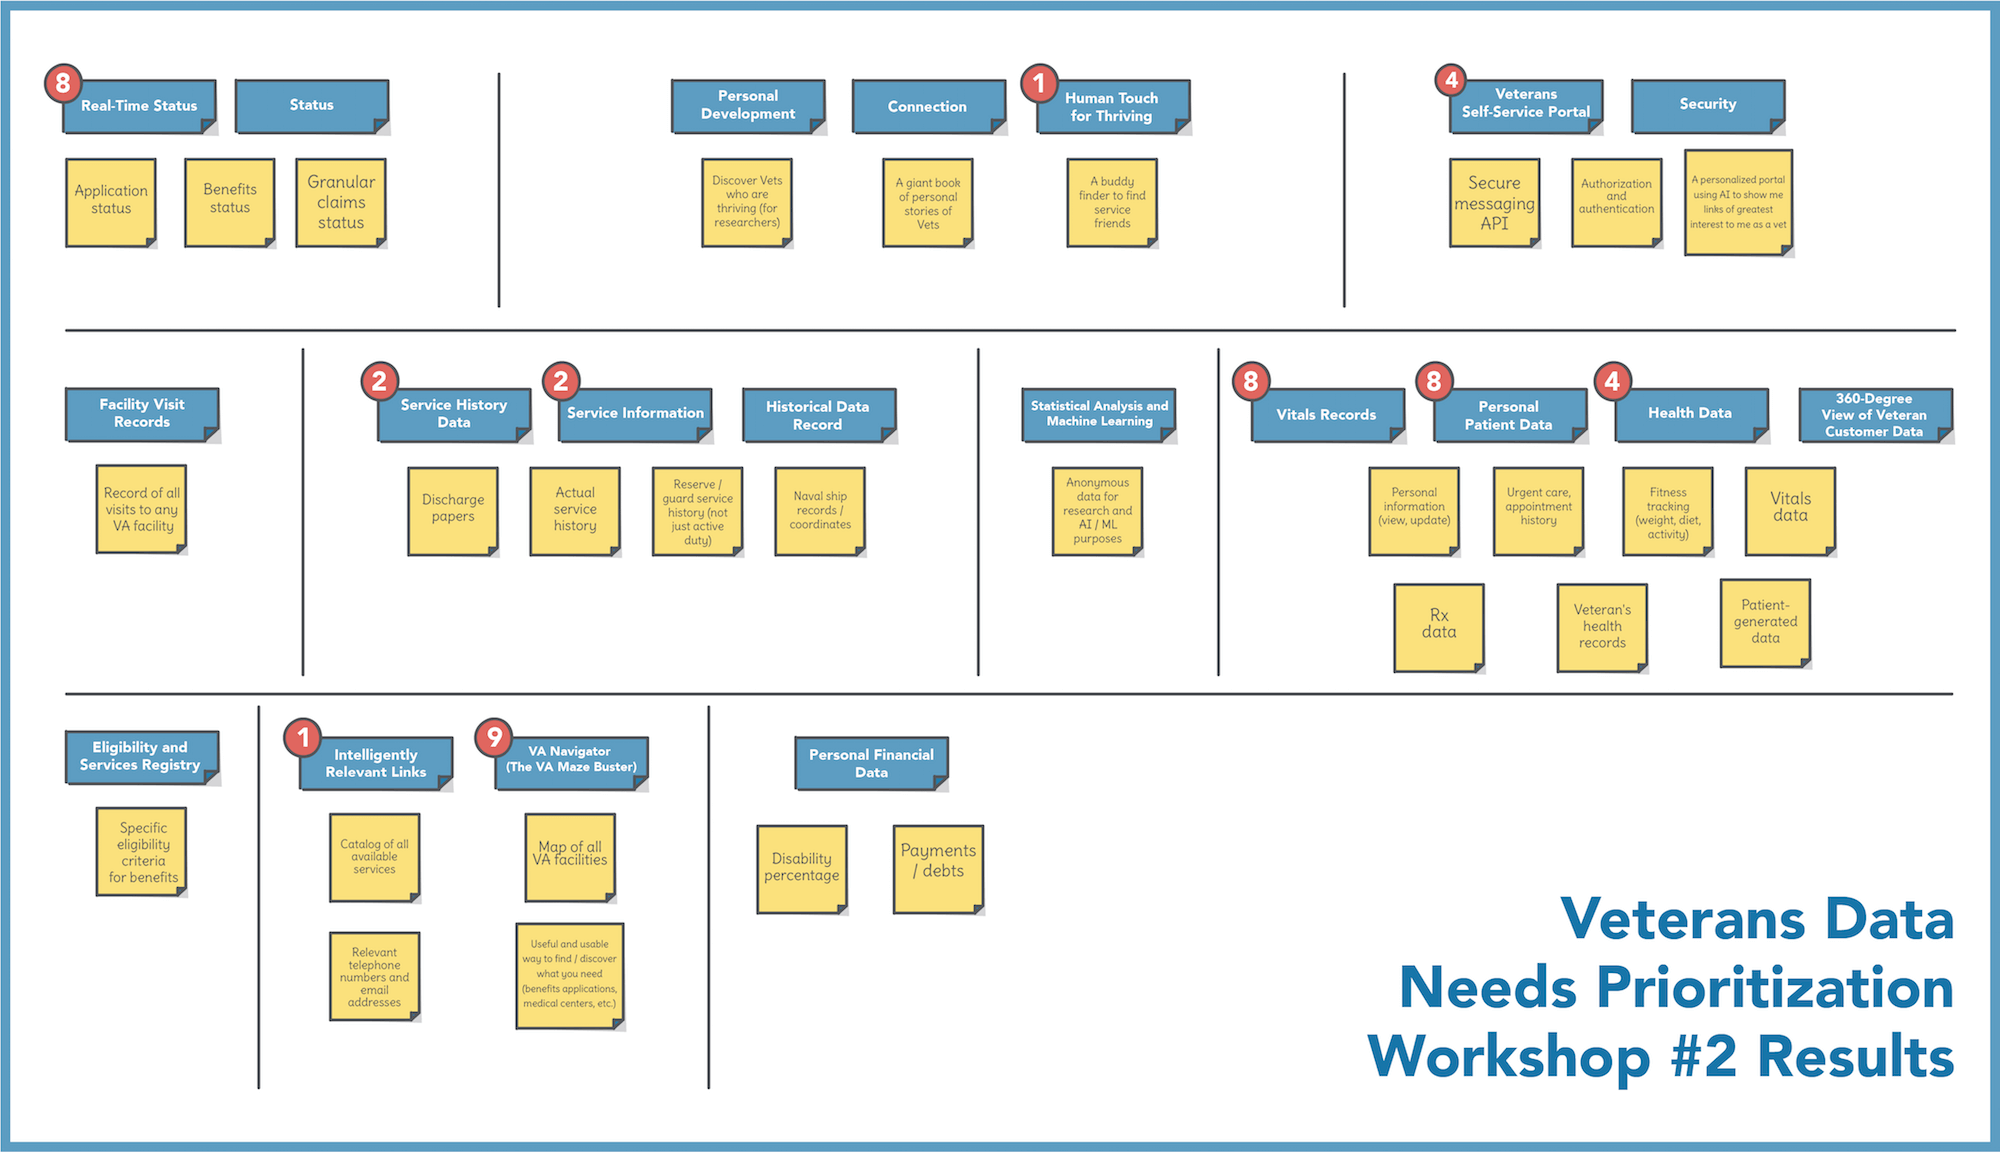
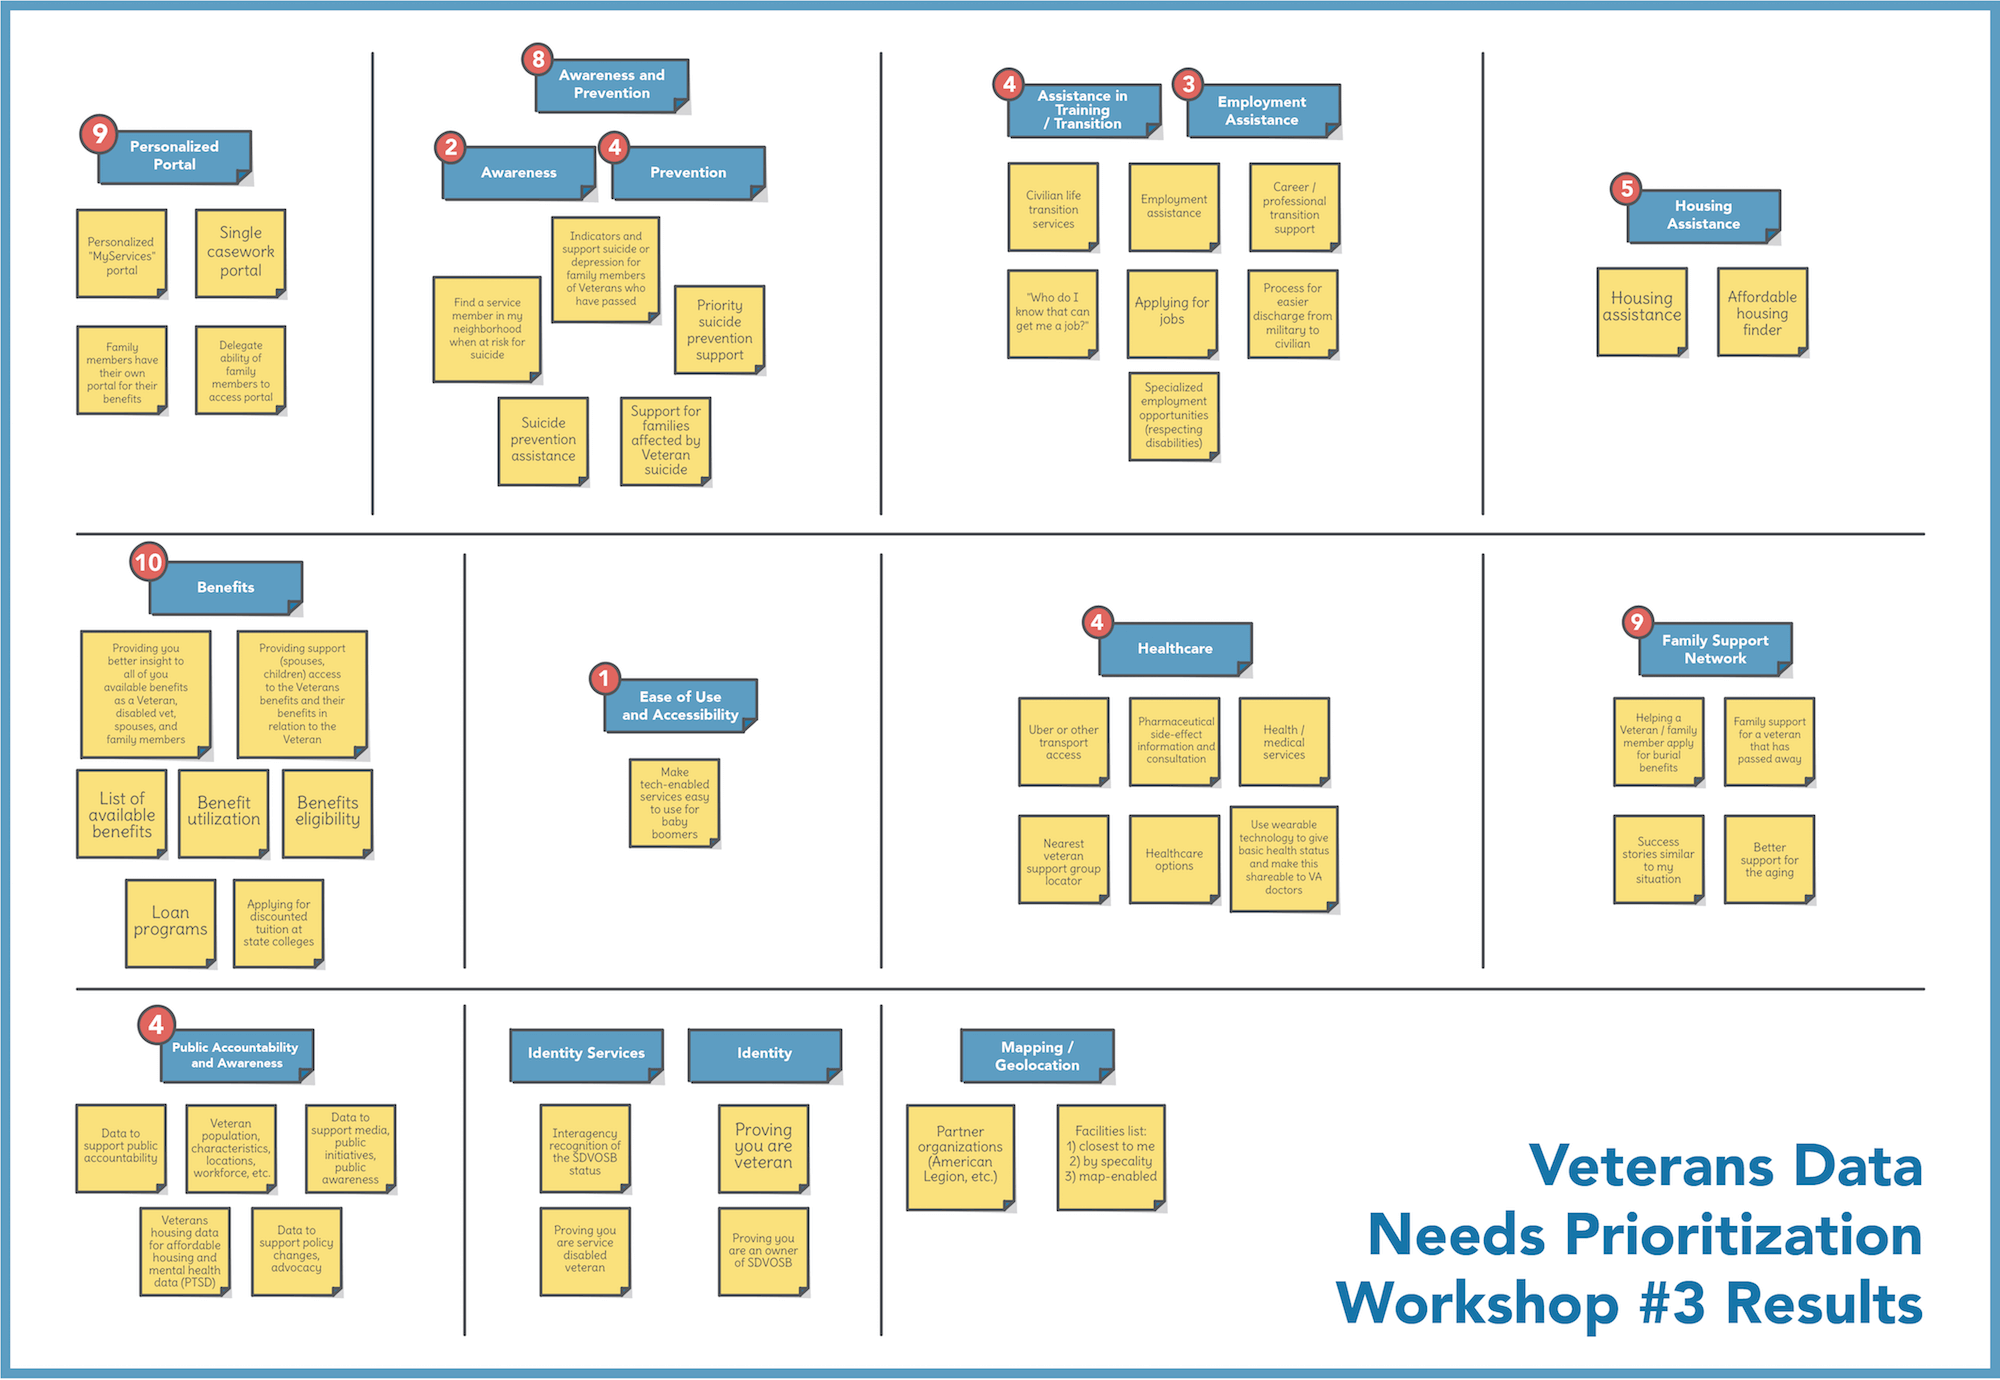
The yellow cards represent all the ideas, in response to the focus question, that everyone brainstormed. As you can see, these yellow cards were organized into like groups. The blue cards represent descriptive labels that participants gave to each group. The black circles with numbers represent the votes that the participants casted when asked which group labels they thought best answered the focus question. We weighted Veteran votes 2x more heavily than votes from non-Veterans.
You may notice things that seem out of place in the final results (for example, yellow cards that look like they belong to another category). This is largely due to the timeboxed nature of the activities. In other words, not everything could be made perfect, but that doesn’t detract from the overall usefulness of the results.
Given the fact that the results were spread across three different workshop sessions, we took the additional step of normalizing the groupings and merging the votes.
-
Directory of Services/Resources – 34 votes
-
Mental Health – 21 votes
-
Personal Healthcare Data – 20 votes
-
Personalized Self-Service Portal – 20 votes
-
Benefits – 13 votes
-
Peer Support Networking – 8 votes
-
Family Support Networking – 9 votes
-
Real-Time Status – 8 votes
-
Patient Experience Data – 7 votes
-
Military-to-Civilian Transition – 7 votes
-
Ratings and Calculators – 6 votes
-
Appointments – 6 votes
-
Medical Healthcare – 5 votes
-
Housing Assistance – 5 votes
-
Public Accountability and Awareness – 4 votes
-
Service History Data – 4 votes
-
Veteran Status Verification – 0 votes
-
Statistical Analysis and Machine Learning – 0 votes
-
Metadata Support – 0 votes
-
Documentation – 0 votes
It’s entirely possible that these groupings could be further normalized, or even some of the ideas within the original groups split out into separate groups. Some groupings could even be disregarded as irrelevant (for example, Metadata Support). However, we didn’t want to dilute the results of what the participants came up with. Somewhat surprising is the low number of votes for Medical Health. That may be a result of lacking the right type of participant representation in the workshops, at least for that particular category.
Summary of the landscape analysis
The landscape analysis, which only processed about 1/3 of the URLs targeted for spidering over the course of a two-week period, revealed about 20,216 data files. This work produced a lot of data to wrangle and make sense of. Each of the data formats made available tell their own story about what types of data has been published to VA websites and why. The number of times a resource has been published using a particular data format (CSV, XML, JSON, XLS/XLSX, etc.) serves as a vote for making that resource available and accessible on the web.
Despite the huge amount of information to work with, we believe that our analysis provides valuable insight into some of the most relevant data resources, based on years of publication to VA websites. The top resources identified from all of the URLs, file formats, tables, and forms all point to data resources that should be considered turning into APIs. If these data resources were considered a priority when publishing to the VA’s websites, then there’s a good chance that they should be considered priorities when it comes to publishing via APIs as part of the Lighthouse initiative.
Lighthouse program considerations moving forward
Resources to prioritize
After spending time with all of the data uncovered during the landscape analysis, we began to see patterns emerge from across all the resources being published to the VA’s web properties, as well as those resources identified by people during our facilitated workshops. So based on analysis of the available data, we recommend that the VA Lighthouse program give consideration to prioritizing the following 25 resources:
-
Healthcare Facilities – Up-to-date information on hospitals, clinics, and other healthcare facilities.
-
Organizations – Details on any type of organization that services Veterans and their families.
-
Services – Services being offered by the VA, healthcare facilities, and other organizations.
-
Programs – Programs being offered by the VA, healthcare facilities, and other organizations.
-
Resources – Content, video, and other resources providing healthcare, outpatient, and other relevant content.
-
Schedules – The schedules of healthcare facilities, organizations, services, and programs being offered.
-
Events – Calendar and details of relevant events that service Veterans around the country.
-
Benefits – Details of the benefits being offered to Veterans, including elements of the process involved.
-
Performance – Performance details for the healthcare facilities, organizations, services, and programs.
-
Insurance – Home, auto, and healthcare insurance information that Veterans can take advantage of.
-
Loans – Information on home, auto, and other types of loans available to Veterans and their families.
-
Grants – Grants for education, businesses, projects, and other Veteran-focused efforts.
-
Education – Educational opportunities and information available to Veterans and their families.
-
Training – Specific training opportunities available that Veterans can take advantage of.
-
Jobs – Job postings that Veterans can apply to and use to guide their career.
-
Human Resources – VA human resources and related information in support of VA employees and Veterans.
-
Forms – Directory, access, and management of forms and the data that’s stored within them.
-
Budgets – Budget information on healthcare facilities, organizations, programs, and services.
-
Statistics – Statistics and data on all aspects of VA operations, and anything that impacts Veterans.
-
Cemeteries – Details of the cemeteries, and the Veterans who are laid to rest at all locations.
-
News – News that impacts Veterans from across any source and is relevant to the community.
-
Press – Press releases from the VA and related organizations and programs.
-
Research – Information and other resources produced as part of specific Veteran-related research.
-
Surveys – Centralized organization, access to, and the results of Veteran and program-related surveys.
-
FOIA – Process and information related to Freedom of Information Act (FOIA) efforts occurring at VA.
These resources represent what was harvested and analyzed as part of our landscape analysis, merging many of the patterns present across individual datasets. They’re organized using a REST-centric approach to turning data into API resources, which allows for data access via HTTP. Many of the keywords identified as part of the landscape analysis have been rolled-up into higher level areas — such as PTSD, mental health, and suicide — would exist across services, programs, and resources.
These suggested resources are derived from about 65% of the top-level resources identified across all the top paths, file formats, tables, and forms. They represent a nice cross-section of resources across all the data formats, but also reflect the general web presence of the VA. Our list also provides a coherent stack of resources that could be developed, deployed, and maintained in support of the central veteran APIs, offering personalized and generalized data experiences that would benefit Veterans and their families.
Centralize focus on the Veteran
From a data perspective, the most important resource above all is the Veteran and their personal data. Therefore, the identity and healthcare record of a Veteran should be at the front and center of any API deployed as part of the Lighthouse API platform initiative. This requires full knowledge and accurate information about a Veteran. In others words, in order for the Lighthouse’s APIs to work well, there must be a robust identity and access management in place, as well as detailed, layered, portable, and usable Veteran profiles.
Increase personalization
One thing that became evident during our work is the need for greater personalization of data across almost every resource that we identified. Where there’s value in having general information available (for example, medical facilities), this data becomes exponentially more valuable when it’s personalized, localized, and made more relevant to the Veteran who is browsing, searching, engaging. Therefore, there are two types of engagement models with the resources that we propose: (1) general access without knowledge of the Veteran and (2) personalized knowledge of the Veteran via custom configuration settings that determine the relevancy of the data and content when these are made available via APIs and within applications.
There are existing portal efforts such as vets.gov that are available as part of the VA’s online presence. The personalization efforts occurring there should be reflected across the design and operation of the Lighthouse’s APIs. By designing APIs to operate in generalized or personalized mode, this would empower API developers to act on behalf of a Veteran using OAuth tokens. If a token’s present, each API will act in a more personalized manner and allow for localization based upon a Veteran’s preferences and history of interactions. This personalization layer should act as a bridge between the core healthcare record of a Veteran and the other resources that we outlined above.
Writing, not just reading data
Many of the resources that we identified represent read-only access to data and content. It’s important to note that getting access to data and content is useful; however, a significant portion of the resources that we harvested and gathered through conversations with the community will require the ability to write information via APIs. Forms, surveys, and other feedback loops will need to allow for APIs that not only GET data, but also POST and PUT data as part of their operations. This additional operations will round-off the Lighthouse’s stack of resources, helping to ensure that services provide a two-way street for engaging with the VA community.
In addition to reading, the ability to write data and content will be a deciding factor in whether applications built on top of the APIs will deliver meaningful value to Veterans and their supporters. If information is only being pushed outwards, many applications will be seen as having little to no value to users, developers, and operators of the Lighthouse API platform. To help ensure meaningful value is delivered to everyone involved, all applications should be capable of sharing usage data and feed analytics and support feedback loops between users and the platform operators. With the ability to write data, the APIs will lack meaning and substance, and will contribute to lack of adoption and integration.
Focus on the source of the data
A common misconception in conducting a landscape analysis such as the one we performed is to assume that the data discovered can be published via any APIs that are deployed as part of the next phase of work. That’s rarely the situation, because most of the discovered data is just published snapshots derived from existing data sources. This is certainly the case with the VA. Much of the data we discovered is unusable in its current state due to lack of normalization, duplication, being out of date, and other noise and clutter. Many of the XML and JSON files identified provider a much cleaner option for transforming into web APIs. However, with any resource identified, it’s more desirable to integrate the original source of data than relying on published snapshots.
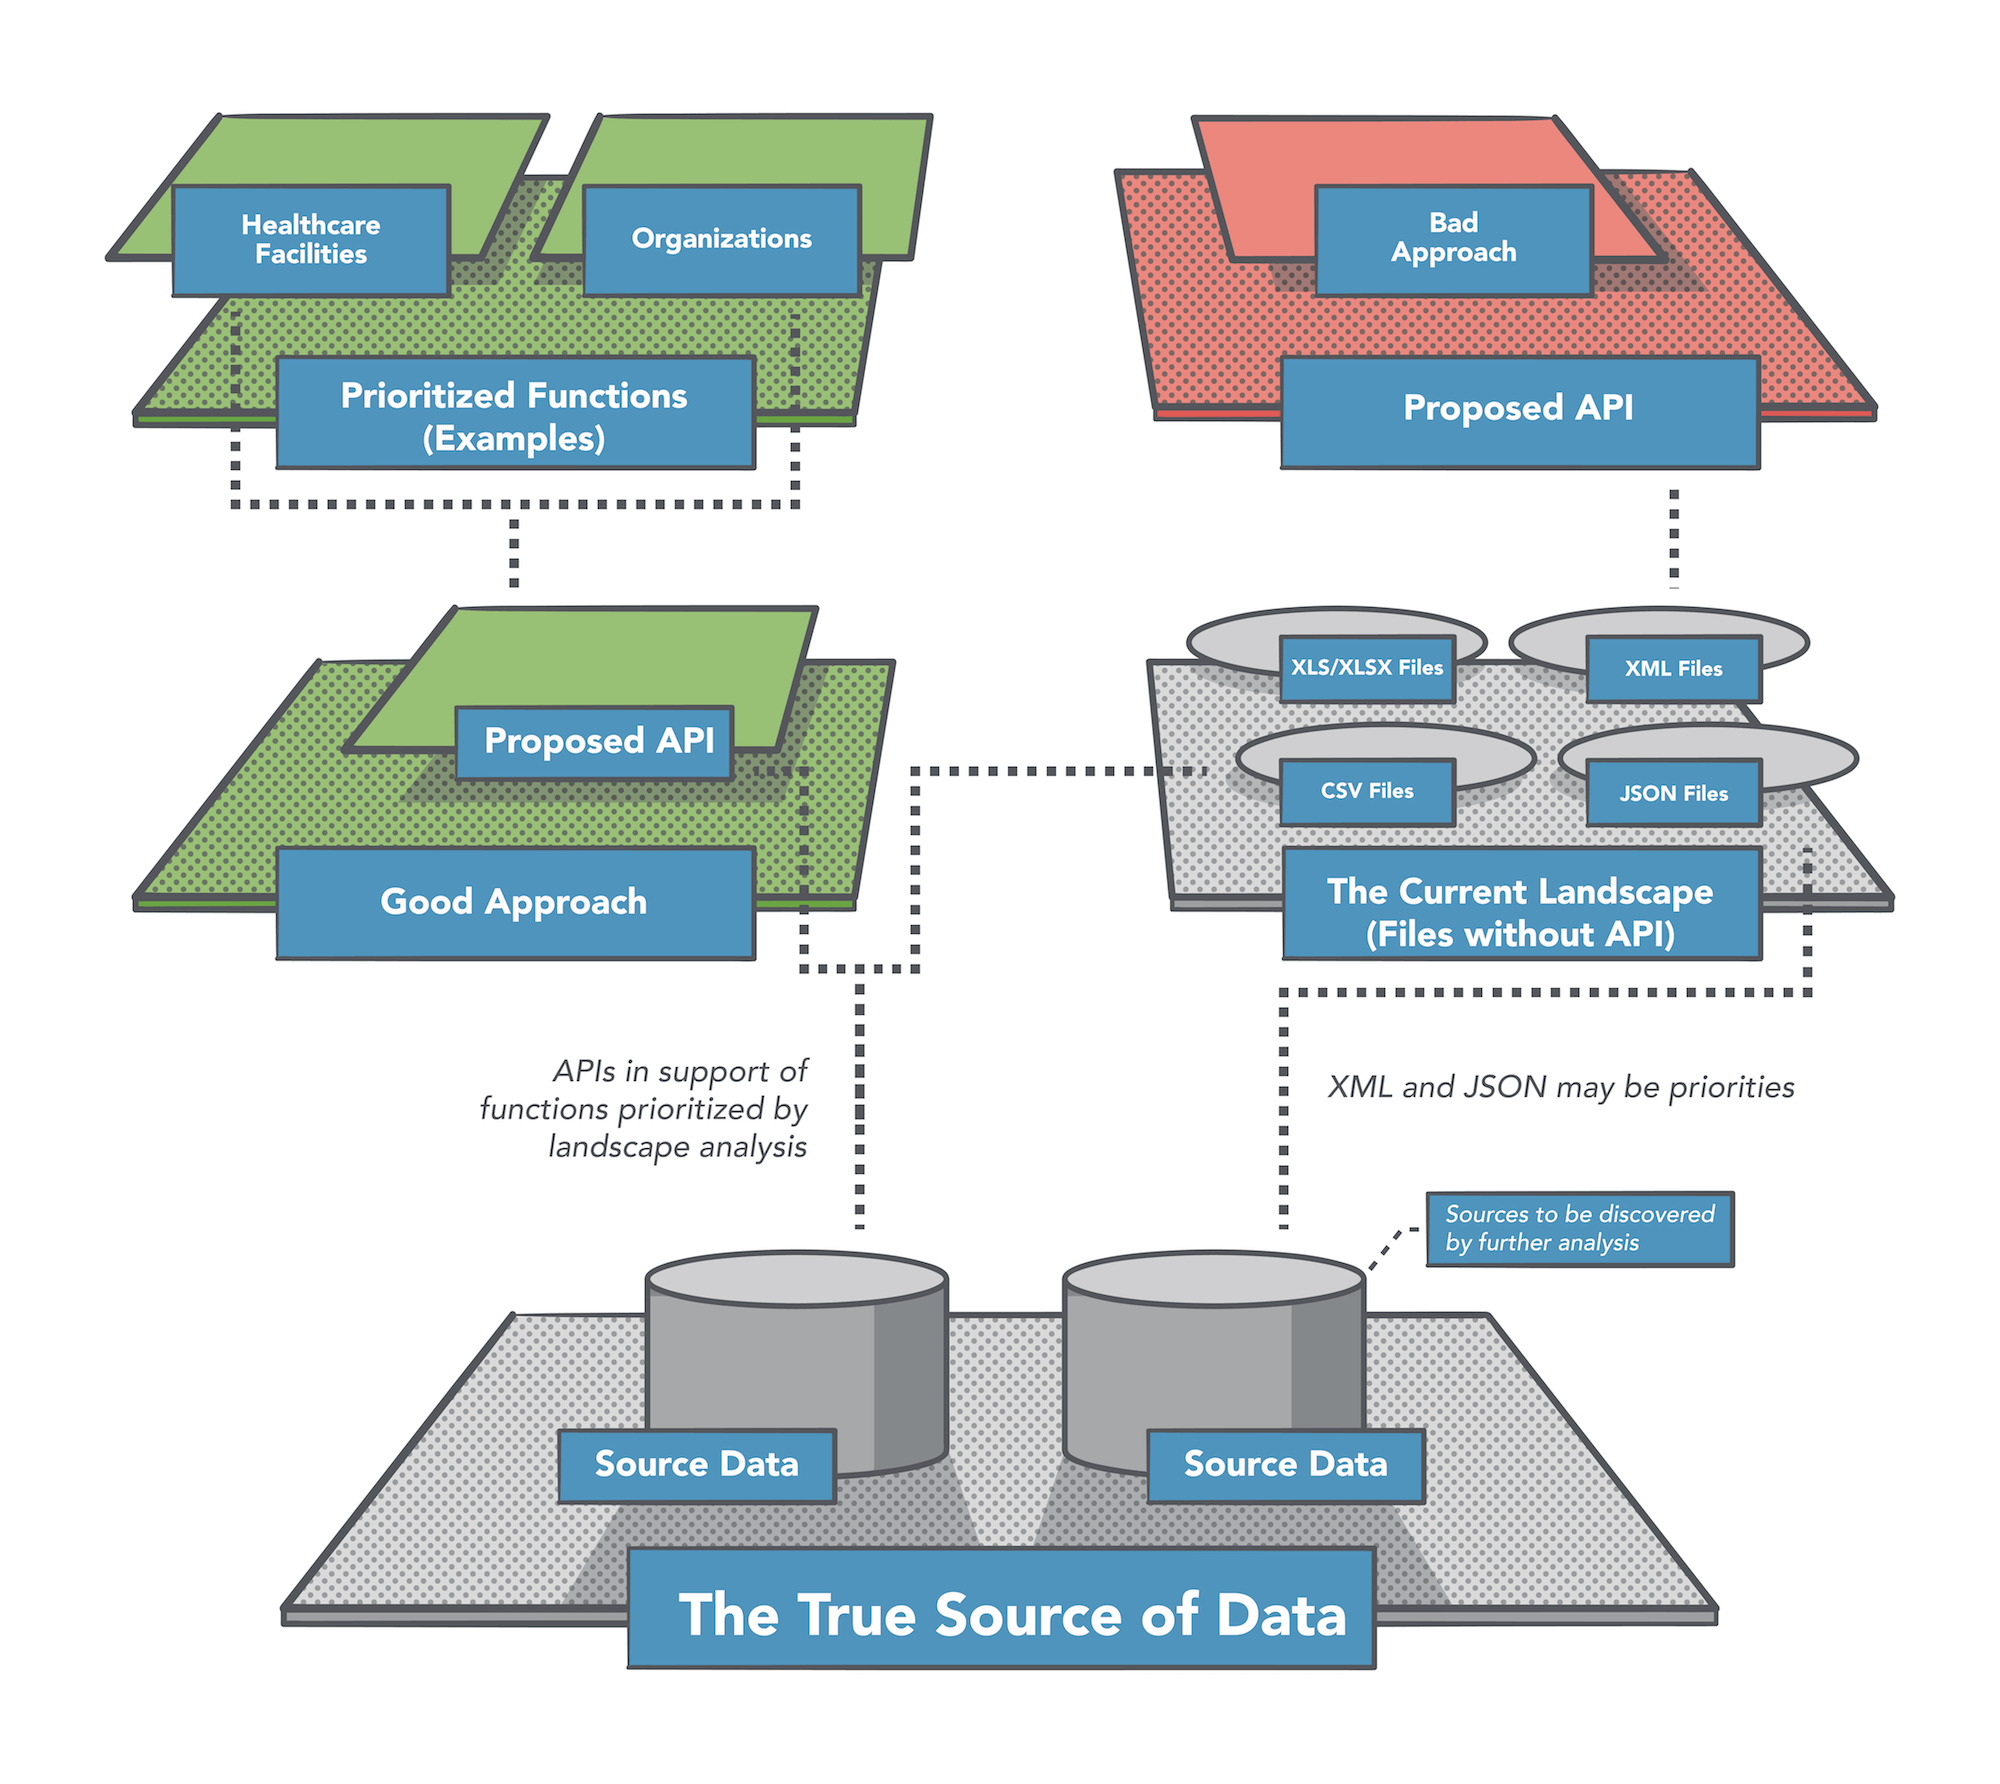
Even after coming to a consensus on the data resources to transform into APIs, the next phase of work should focus on identifying the data sources for each of the targeted resource areas, and not relying on published data that already exist across websites. While it’s tempting, and sometimes necessary to rely on published data for the source of API data, it increases the chance that an API will eventually become dormant, out-of-date, and cause many of the issues that we’ve seen play out with the existing VA datasets. Our landscape analysis came at the resource prioritization from an external, public perspective. We recommend a subsequent, more internal landscape analysis to identify the data sources for important resource types emerging from this landscaping effort.
Improve domain management
Moving forward, it’d be logical to have a standardized approach to naming subdomains for both web and API properties in support of VA operations. Establishing a common approach to naming city, state, regional, program, research, and other resource areas would provide human- and machine-readable access to these resources. This might be difficult to do for web properties with so much legacy infrastructure, but the API platform provides an opportunity to establish a standardized approach moving forward.
Leverage common data formats
Our landscape analysis revealed a lack of a consistency when it comes to vocabulary, schema, and data formats. Most of the data published is derived from an existing system or represents a human-directed process. There’s a significant amount of fluff and noise surrounding these valuable data and a lack of consistent naming and field types.
Based upon the resources that we’ve identified for your consideration, there are a handful of existing data formats the VA should consider. Some of these are already underway, while others are not currently reflected in the Lighthouse’s efforts, but are used by other government entities to publish data in a consistent manner.
-
Fast Healthcare Interoperability Requirements (FHIR) – FHIR is already in-motion at the VA, but worth highlighting here. FHIR provides an anchor for why common data schema formats are relevant to other resources beyond Veteran healthcare records.
-
Open Referral (211) – Open Referral is a common schema and API specification for defining human services, including organizations, locations, and services, along with all the supporting information and metadata that goes with this core set of resources.
-
Open311 – Open311 is a common data format for reporting problems and issues at the municipal level, but can easily be adopted for establishing feedback loops at any level of government. It provides a common schema for how large volumes of information get submitted via API infrastructure.
-
Schema.org – A common schema vocabulary that provides object definitions for almost every resource identified throughout this landscape analysis, and the recommended list of resources above.
There are undoubtedly other open data formats that can be leveraged. Common microformats and other RFCs should also be considered, but these can be addressed during the define and design stages of the API development lifecycle, once individual resources have been decided upon. Common formats help ensure resources are interoperable and reusable across VA groups; they also help bring teams together to speak in a common language, using a common dictionary, which will go a long ways to standardizing how data is published and consumed.
Improve analytical information
We had hoped there would have been more analytical information available to help rank the resource data that we identified. We did incorporate the ranking information available from data.gov as an input into our resource prioritization. However, we relied mostly on publication frequency and the overall occurrence of each keyword to help weight relevance. The existence of a word in a path, title, and file name gives it a weight, which can be amplified for every occurrence, providing us with adequate levels of prioritization, grouping, and organization to help us understand each topics importance. If a topic exists frequently across VA web properties, and exists as a sectional grouping, and title of data file, it has importance and relevance.
The lack of analytics, or access to current analytics, across existing VA data sources demonstrates the importance of having a consistent and comprehensive analytics strategy across the VA’s data. There should be download counts for all machine-readable files. And, more importantly, real-time analytics for the consumption of this data via simple web APIs. There should be regional- and program-related ata. We should have personalized data that reflects what’s most important to Veterans. We should understand what’s relevant what isn’t through strategically-designed analytics across web and API operations. The lack of analytics is why we’re working to identify relevant data sources, so those can be made more available and analytics become the default — not an afterthought.
Continue refining the landscape analysis
Our landscape analysis produced a lot of information that was messy and difficult to work with. We can continue to make another pass, which would involve refining indexes, optimizing title and filename parsing, and developing key phrase, plural word, and other dictionaries to make the results much more refined.
There was a lot of data to harvest, process, and make sense of in a two-week sprint. However, we feel that we were able to do a good job of making sense of what was captured. Another sprint could easily be spent sorting through all of the data targeted, separating quality datasets from the more messier ones. Creating a dictionary to translate words and rehydrate acronyms would be very useful to help make further sense of what’s available in CSV, XLS/XLSX, JSON, and XML files. More work could also be done around forms: identifying the types available; defining their search mechanisms; defining what input parameters they allow (whether GET or POST); and unlocking further details on how they store data. Form and table data often have a direct connection to backend databases, which make them more valuable than some of the published data files.
All of the data from the landscape analysis has been published to GitHub, minus the primary index of harvested and processed URLs. Those are too big to publish as JSON to GitHub, but we’ll evaluate how best to provide access to each site index using a solution such as Amazon AMI. We also started experimenting with a secondary spider solution in order to generate an index of the VA website and can publish those indexes as separate GitHub repositories within a single GitHub repository when completed. We feel like these newer indexes could provide a much richer approach to understanding the data and content across the VA’s web properties. And allow for other researchers and analysts to fork and work to make sense of the data that they contain.
Incorporate user research
It’s critical that any further landscape analysis focused on uncovering valuable data resources from across the VA’s web presence is combined with user research activities, such as the series of design workshops that we conducted. Doing so will provide a human perspective on what’s most important to Veterans and their supporters.
We strongly encourage the Lighthouse program to conduct a similar workshop activity to the one that we ran, leveraging the VA’s much stronger outreach capability in order to attract an even larger and more diversified representation of the Veteran community’s data resource needs.
We also recommend that the Lighthouse program consider using the service blueprinting technique as a way to help identify and prioritize specific APIs for deployment. For example, a service blueprint could be created for a specific interaction that Veterans have with the VA, such as trying to find information on healthcare facilities. It’s likely that any service blueprints you want to create could be acquired by chunking the work into multiple micro-purchases. At the very least, we recommend trying to do at least one as an experiment. Once specific APIs are identified, you could then map them against a 2x2 prioritization matrix, based on how high they score against two main criteria: Veteran Experience Impact (y-axis) and Readiness to Execute (x-axis).
Conclusion: this journey is just beginning
The landscape analysis for the VA doesn’t end here. Just like the resulting API effort, the evaluation of the VA’s web presence should be an ongoing process. Work should continue to help identify what datasets are being published to the VA’s web properties, and to incorporate these datasets into API operations or to replace them with API-driven solutions. In the long term, there shouldn’t be any tables, forms, CSV files, JSON files, XML files, or XLS/XLSX files without a direct connection to the API platform. Eventually all data should be derived from a federated, but standardized, set of API platforms that are designed, deployed, and managed consistently as part of the VA Lighthouse effort.
Hopefully the work conducted here provides a base of resources for the Lighthouse program to consider as it moves forward. Ideally, everything uncovered as part of this work eventually becomes an API, or part of a suite of APIs. We understand that this won’t be a reality anytime soon, but we worked diligently to uncover the most valuable resources and to provide a concise list of data resources that could be turned into APIs and used to begin driving web, mobile, and desktop applications that serve Veterans and their families. There’s a wealth of resources available to Veterans across the VA’s websites. The challenge now is how do we ensure these resources deliver value consistently across many platforms? A simple, consistent, and usable API stack is the answer.
Lessons to share
This project is one of the VA’s first experiments using the microconsulting model in support of the Lighthouse initiative. Sharing what went well, what didn’t, and what could we have been done better — all in the name of continuous improvement — is the responsibility of everyone involved in order to make not only the Lighthouse initiative a success, but the microconsulting model as well. With that said, here’s what we have to share:
-
We thoroughly enjoyed working on this as a micro-project. We felt that the short-timeboxed, tightly-scoped nature of the work focused our efforts on executing only the most essential activities, giving even more meaning to inherently impactful work. As Parkinson’s Law states, “work expands so as to fill the time available for its completion.”
-
Looking back, our approach to this project involved some known unknowns (and some unknown unknowns) from a technical standpoint. In particular, the question of how well our spidering process could scale to handle the VA’s enormous web footprint. It would have been best to propose conducting an agile “spike” activity as a small micro-project in order to gain risk-reducing knowledge.
-
For micro-projects under a tight schedule and for which there are external dependencies (for example, scheduling interviews or workshops with external participants), some lead time may be necessary before formally kicking off the project.
-
Those people who participated in our facilitated workshops expressed extreme gratitude for the opportunity to contribute to the progress of the Lighthouse program. Working in the open and co-creating with the public will not only foster an engaged community of supporters, but will also lead to better quality outcomes.
-
While our workshop activities were extremely valuable in giving us a human perspective on our landscape analysis, we felt that there could have been even greater representation from the Veteran community. We should have been more proactive about leveraging the VA’s outreach capability to draw in an even more dense and diverse group of Veterans and their supporters.